Skip to content

Reports

Design and automate beautiful data communications to encourage informed collaboration across your team

Don’t let reporting be a chore.
Create and automate visual reports your team will love. 

Beautiful reports with contextualized data

Turn boring reports into informative data stories and efficiently communicate the impact of your work. 

With Dexibit’s drag and drop report design interface, bring life to your data with visualization, text and images. 

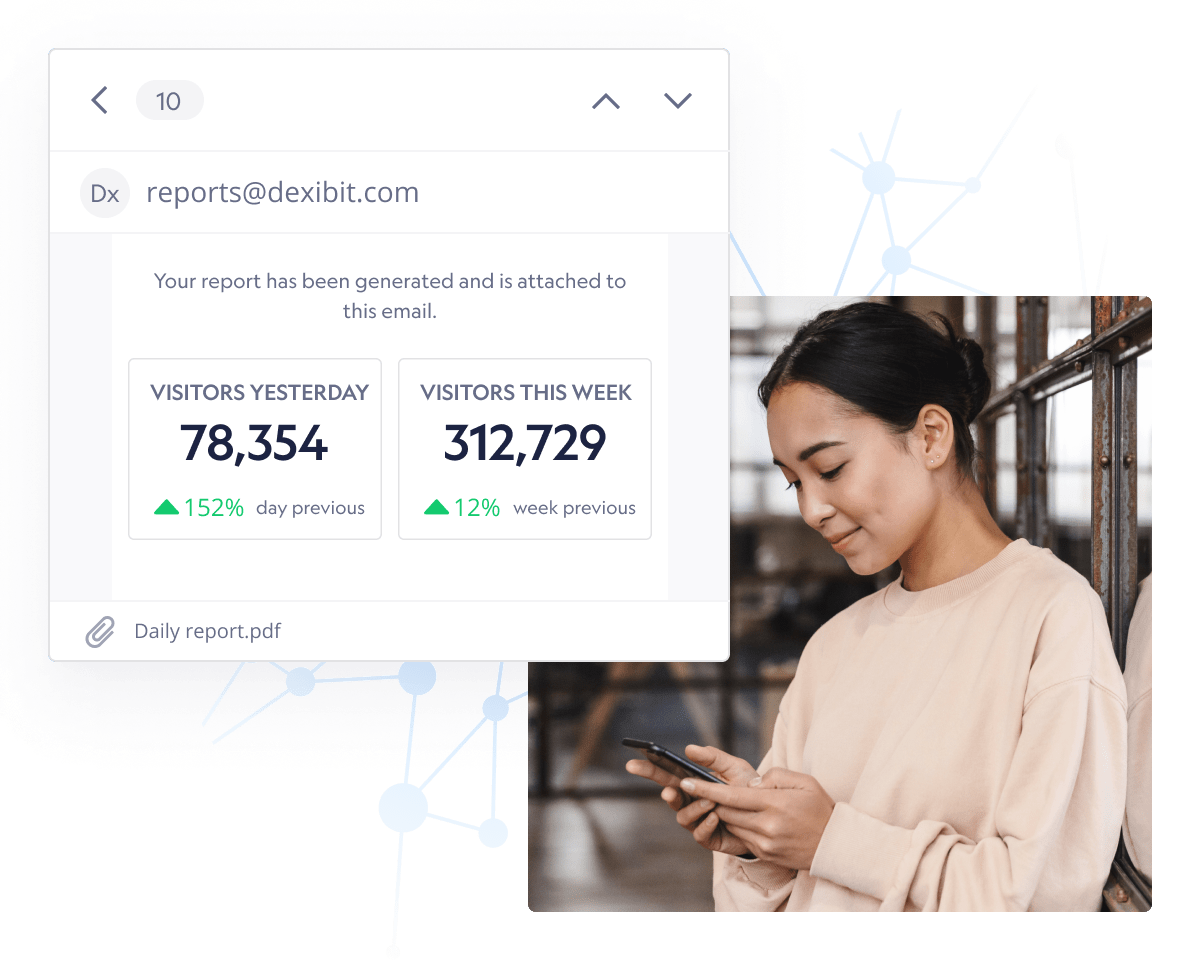
Automate PDF reports directly to email

From all-hands summaries to executive updates, schedule your reports to send anytime, hands free.

Plus, access an auditable archive of reports previously sent, to see what your data looked like at the time. 

Set and forget with relative dates

Simplify report preparation with date ranges which automatically adjusting the historic or forward view of your data based on the date your report is due to be sent.

portrait rachel wolff, MIA
“I continue to be most impressed with how Dexibit worked to meet the moments of closure and reopening, not just through sharing stories and providing access to examples, but also by building multiple now essential tools.”
Rachel Wolff
- Head of Data Strategy and Insights,
Minneapolis Institute of Art

Want to learn more about Dexibit?

Talk to one of our team to hear more about dashboards and case studies on using data to drive growth.

Featured Resources

Discover industry leading resources for visitor attractions professionals

A click by click guide for how to clean up messy data, such as for address data,...
Articles
Understand the real difference between data sovereignty and data residency, and ...
Articles
Is your data really safe just because it lives in your country? In this myth-bus...
Podcast
An inside look at launching a new attraction, building a data culture from day o...
Customer Stories
lounge
Should you build your own analytics solution—or buy one off the shelf? In this...
Podcast
Explore 2025 visitation trends, benchmarks, and macro forces shaping the future ...
Podcast
AUCKLAND (NZ) We're on the lookout for a sales star to join our award winning te...
Understand the difference between forecast, plan, goal and target in visitor att...
Articles
How to embed data, visualizations and dashboards from Dexibit into third party a...
Articles
How to support strategic and operational planning with machine learning forecast...
Articles
Smooth data meetings aren’t a sign of alignment. They can also be a sign peopl...
Articles
How to support strategic and operational planning with machine learning forecast...
Articles
We work through uploading and editing data of any kind, and configuring your dat...
Articles
Learn all the latest tips and tricks for designing beautiful, easy to understand...
Articles
AUCKLAND / REMOTE (NZ) We're on the lookout for a data success star stars to joi...
To showcase how meaningful design tips and tricks are when thinking about your a...
Articles
Creating a successful annual membership or season pass program for visitor attra...
Articles
With inflationary conditions over the past few years, we look at common general ...
Articles
Highlights as we look across the year in review for benchmarks on growth, pricin...
Articles
A look at visitation year on year growth trends and influences for 2024, a year ...
Articles

Download Visitor Excellence Kit

Download Visitor Excellence Kit

As the global leader in big data analytics for visitor attractions, Dexibit takes privacy seriously. Read more about how we treat your privacy.

Download Data Audit Workbook

Download Data Audit Workbook

As the global leader in big data analytics for visitor attractions, Dexibit takes privacy seriously. Read more about how we treat your privacy.

Sign up to our mailing list

Get actionable content sent directly to you. Use these insights to reach visitor management excellence at your attraction.

As the global leader in big data analytics for visitor attractions, Dexibit takes privacy seriously. Read more about how we treat your privacy.