DATA: What impact is the recession having on memberships?
- In Benchmarks
- Data bits, Members, Season passes
- 3 min read
Data from Dexibit’s global portfolio of visitor attractions.
Following a recovery since the pandemic, membership and season pass volumes in visitor attractions have seen a decline the past three quarters. However, this trend seems to be on the mend.
Having previously experienced a return to growth since the pandemic, annual membership or season passes in visitor attractions have recently declined. Slowing new member growth and rising existing membership churn could be attributable to a looming recession as visitors tighten larger discretionary spending.
As at January 2023, member volume in visitor attractions is down 10.57% percent year on year. The year prior in 2022, memberships had been on the rebound with a growth rate of 2.74%. Previously in 2021, membership experienced its largest ever year on year drop in recent times, suffering a 30.72% decline since January 2020 – reflecting the impact of the pandemic.
Over the course of 2022 between the impact of the pandemic and a potential recession, membership had achieved a return to growth, with a first calendar quarter increase of 0.82%. By the second quarter, this trend reversed to 0.26% decline, then deepened to 5.8% reductions in Q3 before improving slightly to a loss of only 4.38% in quarter on quarter member volume in Q4.
Member volume loss appears to be slowing into 2023, with January seeing a reduction to a 2.32% quarter on quarter decline.
Using Dexibit?
Loyalty, from annual memberships or season passes, is an important recurring revenue for the visitor attraction and a great way to learn more about visitors.
In Dexibit you can upload or integrate data from your Customer Relationship Management (CRM) system and connect your marketing automation or email marketing application too.
With this data, you can define your membership products, group and label data, determine how you recognize membership revenue and slice by line.
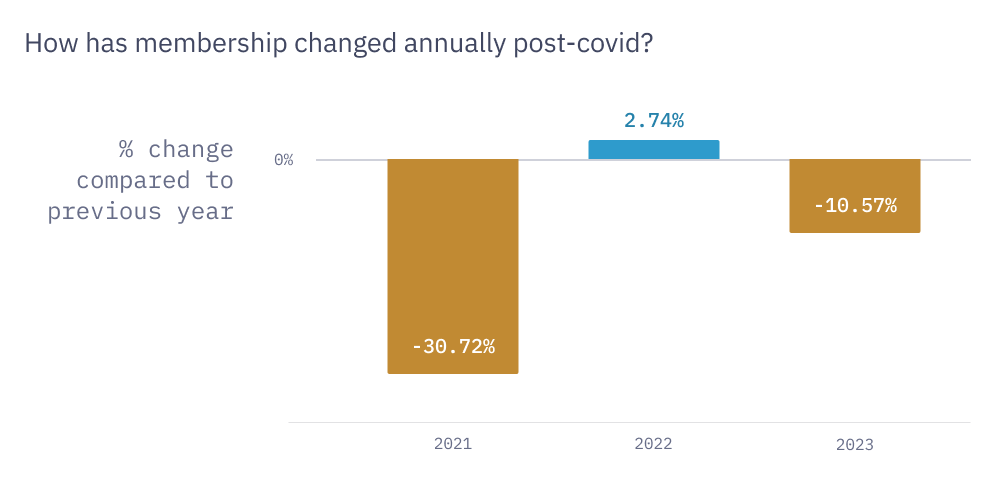
Total member/season pass volumes by year over 2021 – 2023 showing a drop during the pandemic, a recovery since then another decrease from a potential recession
In your dashboards, you can then visualize:
- Performance such as year on year growth, mean and highlights; data over time trends
- Analysis of deeper metrics around growth and churn, member visits and origin
- Conversion to new memberships in conjunction with visitation
- Comparison with other metrics, such as onsite spend
- Forecasts to aid with financial planning
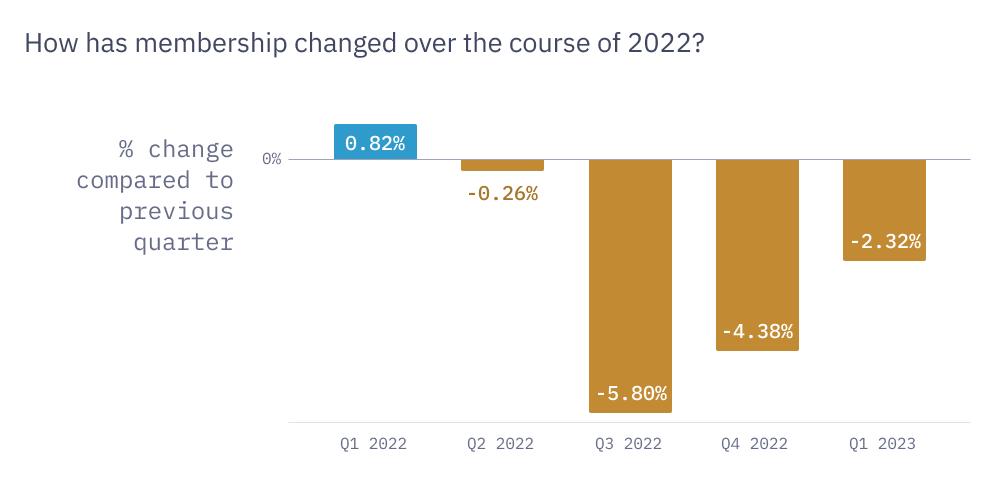
Total member/season pass volumes by quarter over 2022 – 2023 showing an improving decline the past three quarters since Q3 2022

Pooja Padhi
Machine Learning Engineer
Working across both data engineering and data science at Dexibit, Pooja is a data enthusiast with tremendous experience in data modelling, mining, analytics and visualisation, with a keen interest in forecasting and machine learning.


Want to learn more about Dexibit?
Talk to one of our expert team about your vision to discover your data and AI strategy and see Dexibit in action.

