DATA: How does per cap revenue differ over time?
- In Benchmarks
- Data bits
- 3 min read
Data from Dexibit’s global portfolio of visitor attractions.
At the start of each week, from Monday to Wednesday, average revenue per visitor usually fares better than the latter half. This trend started in 2019 but changed dramatically in 2020, becoming more skewed overall since pre-pandemic times.
On Saturdays, even though total revenue is at its peak for the week (given visitation also peaks), per cap revenue is usually at its lowest. Some of this may be down to the use of free events being common on Saturdays, which drives up low yield visitation.
This year, in terms of average revenue per visit, weekends account for just 5% each day of the week’s total. Comparatively, Wednesdays are the best performer, at 20.15%, with Fridays right behind, at 19.6%.
Online, it’s a different story. Thursdays and Fridays contribute the most revenue to the week at 17.7% and 17.2% respectively, with Sundays the lowest at 8.3%, though both onsite and online trends similarly see a changing trend since pre-pandemic times that was most dramatic during 2020.
Before, per cap revenue didn’t change much over the seasons. Over the past few years this has changed. Winter now experiences an increasing per cap ratio of 37.0% in comparison to other seasons, with summer reducing to 8.3%. Spring has shrunk back slightly the past few years but still holds second place at a 33.5% contribution. Fall has seen ebbs and flows to land at 21.1% in 2022.
Using Dexibit?
Business models of visitor attractions are complex. Revenue comes from many different lines of business – consumer or otherwise. This might include ticketed admission, exhibitions, events and experiences, retail from brick and mortar or ecommerce, food and beverage, hires such as for weddings, third party partnerships such as IMAX theaters, membership, donations, grants and so much more. It’s a lot to track and analyze!
In Dexibit you can upload or integrate with your point of sale and other sources such as ticketing or membership. With this data, you can define your lines of business, group and label data, determine what constitutes ‘per cap’ and slice by line.
In your dashboards, you can then visualize:
- Performance such as year on year growth, mean and highlights; data over time trends
- Per cap analysis in conjunction with visitation
- Comparisons with other metrics, such as goals or visitation
- Reporting for channel partner settlement (such as ticket resellers or revenue shares)
- Forecasts to aid with financial planning
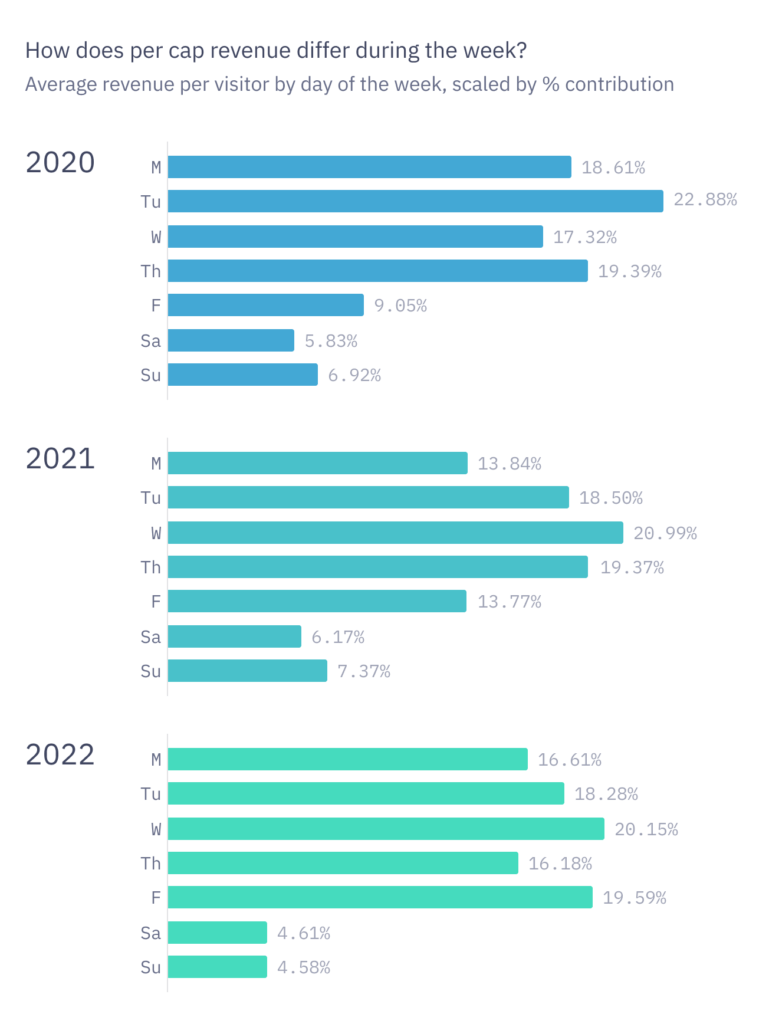
Per cap revenue contribution by day of the week

Pooja Padhi
Machine Learning Engineer
Working across both data engineering and data science at Dexibit, Pooja is a data enthusiast with tremendous experience in data modelling, mining, analytics and visualisation, with a keen interest in forecasting and machine learning.

Want to learn more about Dexibit?
Talk to one of our expert team about your vision to discover your data and AI strategy and see Dexibit in action.

