
10 measures of success in exhibitions
- In Exhibitions and Activities, Visitor Experience
- Articles
- 5 min read
When it comes to exhibitions, ‘performance’ is a debatable term – it’s not just about topline performance. Exhibitions demand a comprehensive view of the value they add to the visitor experience, to the venue as a whole and to society. Having a standardized exhibitions data framework to plan, track and reflect on exhibitions make this possible.
You’ll need a balance of qualitative and quantitative data, before, during and after the exhibition. For the ultimate analysis, compare and contrast across various exhibitions, and explore the visitor behaviors of various exhibition themes, price points or schedules. Try out these ideas:
1. Simulations, plans and goals
Before your exhibition opens, potentially even before you’ve committed to the exhibition itself, it helps to simulate what exhibition attendance will look like. This can include various simulations for different marketing mixes (such as the ticket price or ad budget), with a daily granularity to predict changing audience behaviors and to aid program planning. These simulations can also be used to set the financial plan for the exhibition (in both attendance and revenue), then from there, the exhibition’s performance goals. For more, check out our Insights Bites video on how to simulate exhibitions.
2. Attendance
There are multiple methods to count attendance at an exhibition – including footfall, ticketing or location analytics and potentially, member entry too. If you’re using footfall, this might raise the question of capacity management; for ticketing, the analysis of presales, advance booking schedules and then actual attendance. This method may differ from how your venue counts visitation as a whole, or change between exhibitions or other activities such as events and experiences.
For more, check out our Insights Bites video on how to simulate exhibitions.
3. Supplementary activities
Many exhibitions include additional activities, such as launch events, artist talks and more. Just as with the exhibition itself, it pays to understand how these will be measured, and incorporate the reach of this into the exhibition’s reporting, including its impact on the exhibition’s overall performance.
4. Visitation Uplift
For special exhibitions in particular, you’ll want a way of measuring the effect these have on topline visitation – do they attract visitors to the venue that wouldn’t otherwise visit? There are several methods to achieve this – for example, off a daily average before and after the exhibition, historical visitation performance or best of all, the residual or difference from what was forecast otherwise (using machine learning). These ‘extra’ visitors, plus their financial contributions of admissions and other earned revenue, can be counted towards the exhibitions’ success.
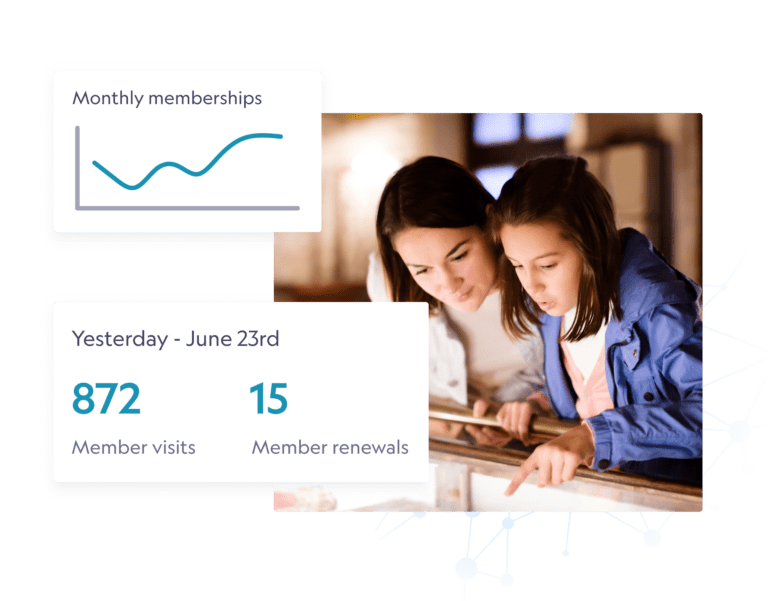
5. Membership impact
Just as for visitation, the same can be analyzed for any uplift in additional member visits (contributing to the member lifetime value while reducing member likelihood to churn), plus potentially an increase to new membership conversion. For any uplift in new members, remember to follow up a year later to look at whether these members renewed, as some exhibitions can cause a temporary spike in new memberships which then don’t persist beyond the first year.
6. Revenue impact
Similarly, revenue across merchandise, hospitality, parking and other lines of business can be analyzed for uplift too. This is particularly notable for exhibition specific merchandise.
7. Onsite Experience
Location analytics (such as RFID, WiFi or BLE) can be used to understand two elements of the exhibition – how visitors are experiencing it within the exhibition, plus the influence it may have on how they experience the wider venue. For example, does dwell time increase or decrease during the exhibition season? Do more or less visitors make it to the shop? What proportion of visitors come just to see the exhibition and don’t venture out into the wider venue?
8. Digital engagement
Email marketing, website traffic and social media statistics all help build a picture of how audiences are engaging online with exhibition promotions and content, which these days should also include any supplementary online exhibitions or streamed events. This data can also be used to analyze the impact of digital on onsite visitation.

9. Earned media through news mentions
Another aspect of reach is to record news mentions of the exhibition itself. An easy way to do this, aside from tracking mentions of the visitor attraction venue name, is to set up Google alerts on key terms relating to the exhibition’s title and curators too. This data can also be used to analyze the impact of press on onsite visitation.
10. Feedback
In addition to the visitor evaluation discovery involved in bringing an exhibition to life, it’s also important to track visitor feedback as the exhibition unfolds. In addition to more involved qualitative study, this can be achieved through social media reviews (especially with keyword mentions relating to the exhibition), Net Promoter Score (NPS) responses or even visitor remarks captured by gallery staff. Sentiment, emotion and keyword analysis help bring this feedback to life and also to help analyze the impact of visitor happiness on other aspects of exhibition performance, such as visitor spend.
For more on data for exhibitions, events and other activities, check out our downloadable playbook below:
Exhibitions and events are the cornerstone of experience.
How can you ensure your planning and simulation leads to a successful launch? Find out what to do create meaningful public programs.
To create successful exhibitions and events, read our latest playbook.

Get insights delivered right to your inbox

Want to learn more about Dexibit?
Talk to one of our expert team about your vision to discover your data and AI strategy and see Dexibit in action.

