DATA: Cultural versus commercial – which attractions segment is recovering faster?
- In Benchmarks
- Data bits
- 3 min read
Data from Dexibit’s global portfolio of visitor attractions.
Between visitor attractions globally, cultural institutions and commercial venues have experienced very different recovery rates, likely driven by a combination of risk profiles from management operating decisions around opening restrictions and by visitor behaviors in their likelihood to visit.
Overall, commercial attractions have benefited from a stronger recovery in visitation when comparing current visitorship levels to a pre pandemic baseline, with overall recovery at 77% for commercial versus 60% for cultural.
This trend has occurred consistently over the pandemic years, with commercial attractions enjoying a starting point of 38% recovery in 2020, leaping to 81% in 2021 and now as high as 98% for 2022 thus far. For their cultural counterparts, 2020 opened at 29%, rising to 66% in 2021 and up to 71% for 2022 to date.
Within the market segment of cultural institutions more specifically, there is also significant variation between different venue sub types. For example, history museums are consistently outperforming their art museum counterparts at 64% to 45%, which may be due to the varying demographics of their visitor base. As at the first half of 2022, this gap had closed somewhat down to 72% and 69%.
Using Dexibit?
All Dexibit plans, including our free visitation dashboard, benefit from access to industry benchmarks with our unique Recovery Index:
- In Dashboards (search in your visualization library), look for benchmarks to access recovery over time, or recovery by days in
- Add your daily visitation stats to plot your venue’s recovery against pre pandemic performance (we recommend adding data for 2017 – 2019 plus data since reopening)
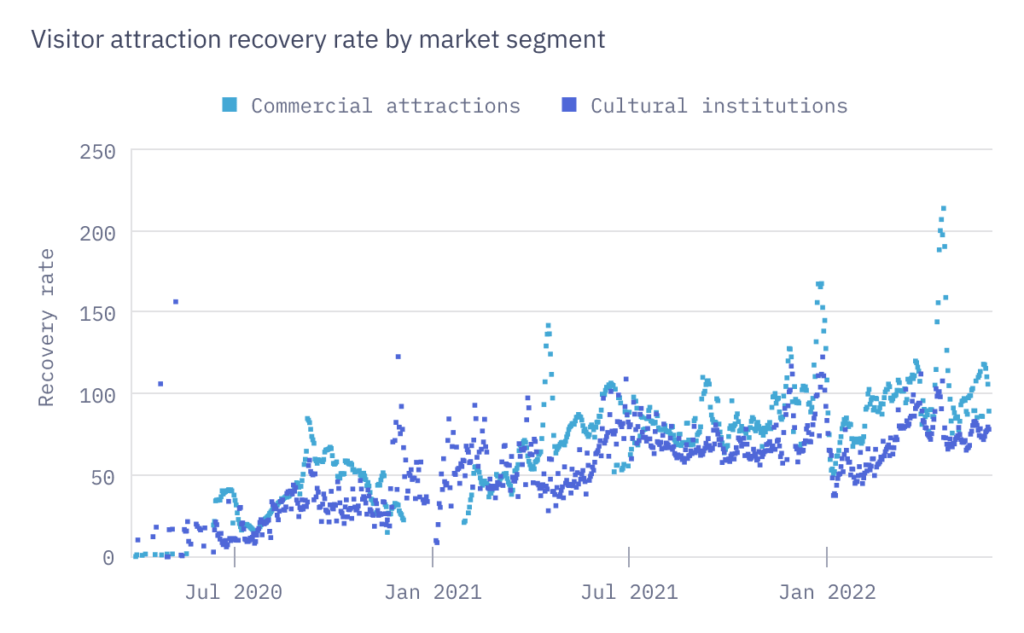
Average recovery rate over the course of the pandemic, Global venues attractions sector data by segment
Dexibit’s Recovery Index for visitor attractions is calculated on a daily basis (where venues are open and data is available) from visitation compared to 2017 – 2019 when comparing similar days, as a rolling mean average.

Pooja Padhi
Data Engineer
Working across both data engineering and data science at Dexibit, Pooja is a data enthusiast with tremendous experience in data modelling, mining, analytics and visualisation, with a keen interest in forecasting and machine learning.


Want to learn more about Dexibit?
Talk to one of our expert team about your vision to discover your data and AI strategy and see Dexibit in action.

