DATA: How are visitor attractions recovering post pandemic?
- In Benchmarks
- Data bits
- 3 min read
Data from Dexibit’s global portfolio of visitor attractions.
Understanding how your venue’s visitation measures against a pre pandemic baseline helps add context for how the year is unfolding. It’s also useful if you’re thinking about your future goals and as a point of comparison with industry.
With closures, capacity limits and a lack of tourism, the visitor attractions sector was one of the hardest hit industries during the pandemic years and is still in a period of recovery.
Much of the world has lifted stay at home restrictions, border closures and venue controls in favor of light isolation requirements for positive test cases. As a result, visitor attractions are seeing an average of 75% recovery in visitation compared to 2017 – 2019 (as a rolling 7 day average comparing similar days).
This rate of recovery is a significant uplift from the original reopening of 30% in 2020 and further progress on recovery of 68% in 2021, reflecting an overall upwards trajectory.
In the northern hemisphere spring season just concluded, recovery rates have similarly lifted from 18% in 2020 to 58% in 2021 to 84% in 2022, showing this trend set to continue even over the coming high season.
Using Dexibit?
All Dexibit plans, including our free visitation dashboard, benefit from access to industry benchmarks with our unique Recovery Index:
- In Dashboards (search in your visualization library), look for benchmarks to access recovery over time, or recovery by days in
- Add your daily visitation stats to plot your venue’s recovery against pre pandemic performance (we recommend adding data for 2017 – 2019 plus data since reopening)
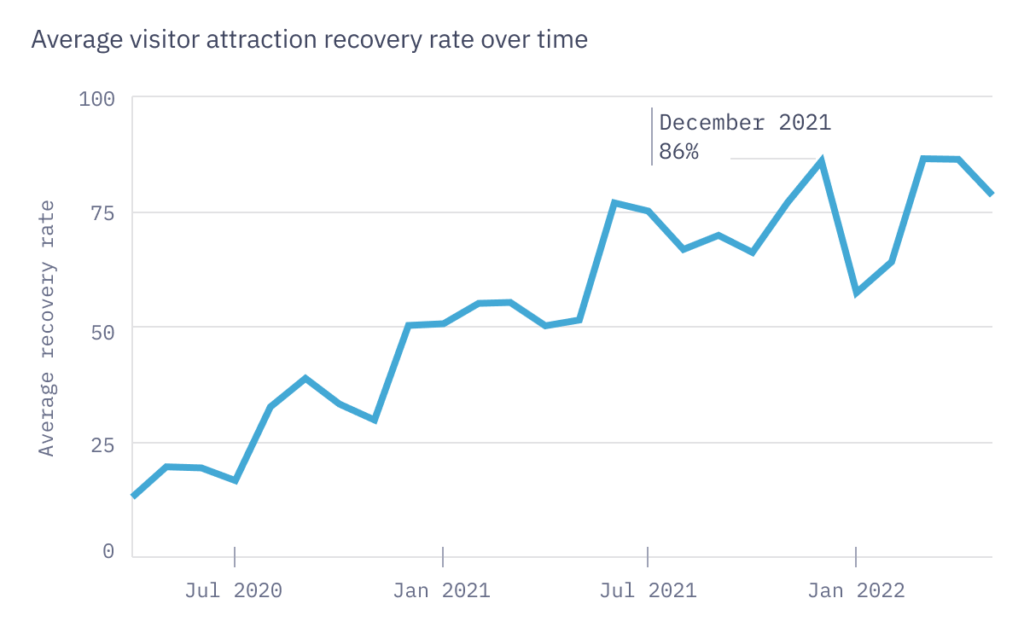
Average recovery rate over the course of the pandemic, global attractions sector data
Dexibit’s Recovery Index for visitor attractions is calculated on a daily basis (where venues are open and data is available) from visitation compared to 2017 – 2019 when comparing similar days, as a rolling mean average.

Pooja Padhi
Data Engineer
Working across both data engineering and data science at Dexibit, Pooja is a data enthusiast with tremendous experience in data modelling, mining, analytics and visualisation, with a keen interest in forecasting and machine learning.

Want to learn more about Dexibit?
Talk to one of our expert team about your vision to discover your data and AI strategy and see Dexibit in action.

