DATA: How does visitor behavior for school breaks change through the year?
- In Benchmarks
- Data bits
- 3 min read
Data from Dexibit’s global portfolio of visitor attractions.
Data on the impact of school term breaks helps with strategic planning such as scheduling programs or operational decisions such as staff resourcing. However, in the highly seasonal business of visitor attractions, not all school holidays were created equal. It’s important to understand the nuances of how various school holidays perform when comparing visitation results.
While overall school holidays increase visitation on average, each term break varies widely in the degree to which it impacts visitor behavior. In some venues, this also has a potential causal relationship with the existing program schedule. When considering the wider context in which a visitor determines their behaviors, this may also be influenced with traditional overseas holiday travel, or a correlation with factors such as seasonal weather patterns driving visitors indoors or outdoors.
Overall, winter school holidays see the greatest impact, which in the attractions sector is also when many venues will be seeing fewer visitors anyhow, with visitation rising by 35% on average and 44% for school holiday weekdays specifically – a 9% difference between the two. Similarly, spring sees the same variation, though overall is the least impacted across all days at a 16% increase, more concentrated towards weekdays only at 25%.
Summer sees very little variation between the school term and break when speaking both generally and for weekdays specifically – 18% and 17% respectively (somewhat influenced by the fact that many more days during summer are holidays). This is the only school holiday season when the impact of the holiday is less when just looking at weekdays.
Lastly, in the fall we see the highest variation – a 34% overall increase with up to 51% specific to weekdays, making fall weekdays a time where school holidays have the greatest impact on visitor behavior.
Using Dexibit?
Here’s how to use Dexibit to gain insights on school holidays:
- In Almanac (a calendar of what’s on in and around your venue), you’ll find the local school holidays for your region and can edit these if you’d like
- In the Dashboard (search in your visualization library), look for visitation summary and visitation impact to discover and compare average daily visitation
- Use the Calendar control to analyze various seasons over the course of the year
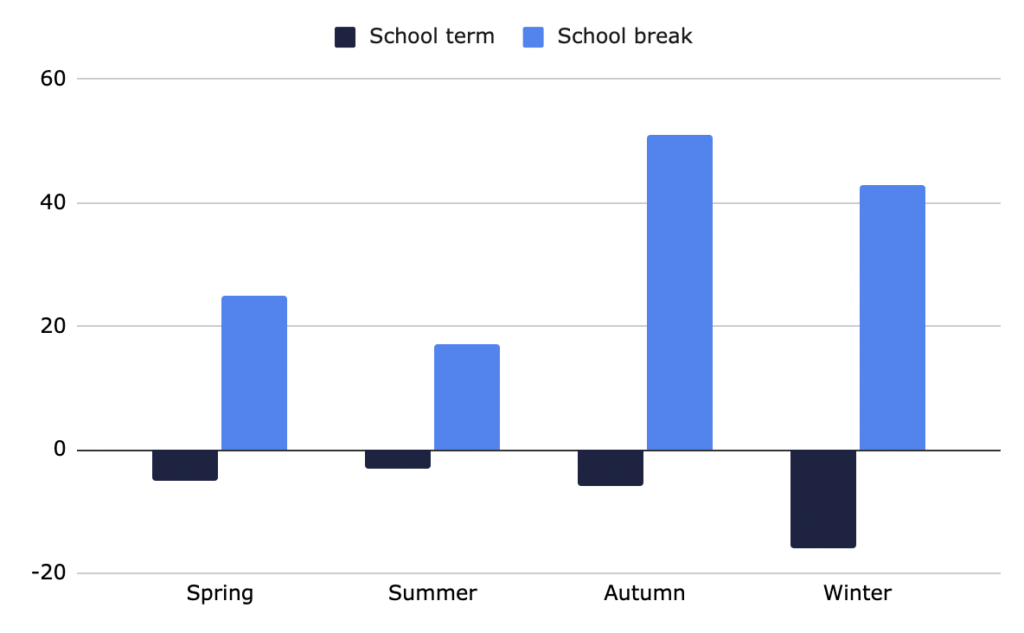
Visitation impact, weekdays

Victoria Alogna, PhD
Senior Data Scientist
Victoria’s data science practice in and passion for machine learning, natural language and measurement comes from a unique perspective into visitor behavior, inspired by her background in the cognitive and behavioral sciences.


Want to learn more about Dexibit?
Talk to one of our expert team about your vision to discover your data and AI strategy and see Dexibit in action.

