How Dexibit works
Integrate data from your software, hardware and digital systems into Dexibit for dashboards, reports, insights and forecasts, with ready built visualizations designed specifically for visitor attractions

Integrate data from your software, hardware and digital systems into Dexibit for dashboards, reports, insights and forecasts, with ready built visualizations designed specifically for visitor attractions

Democratize data, reduce time to insight and power growth with Dexibit’s comprehensive analytics solution and unique data concierge.
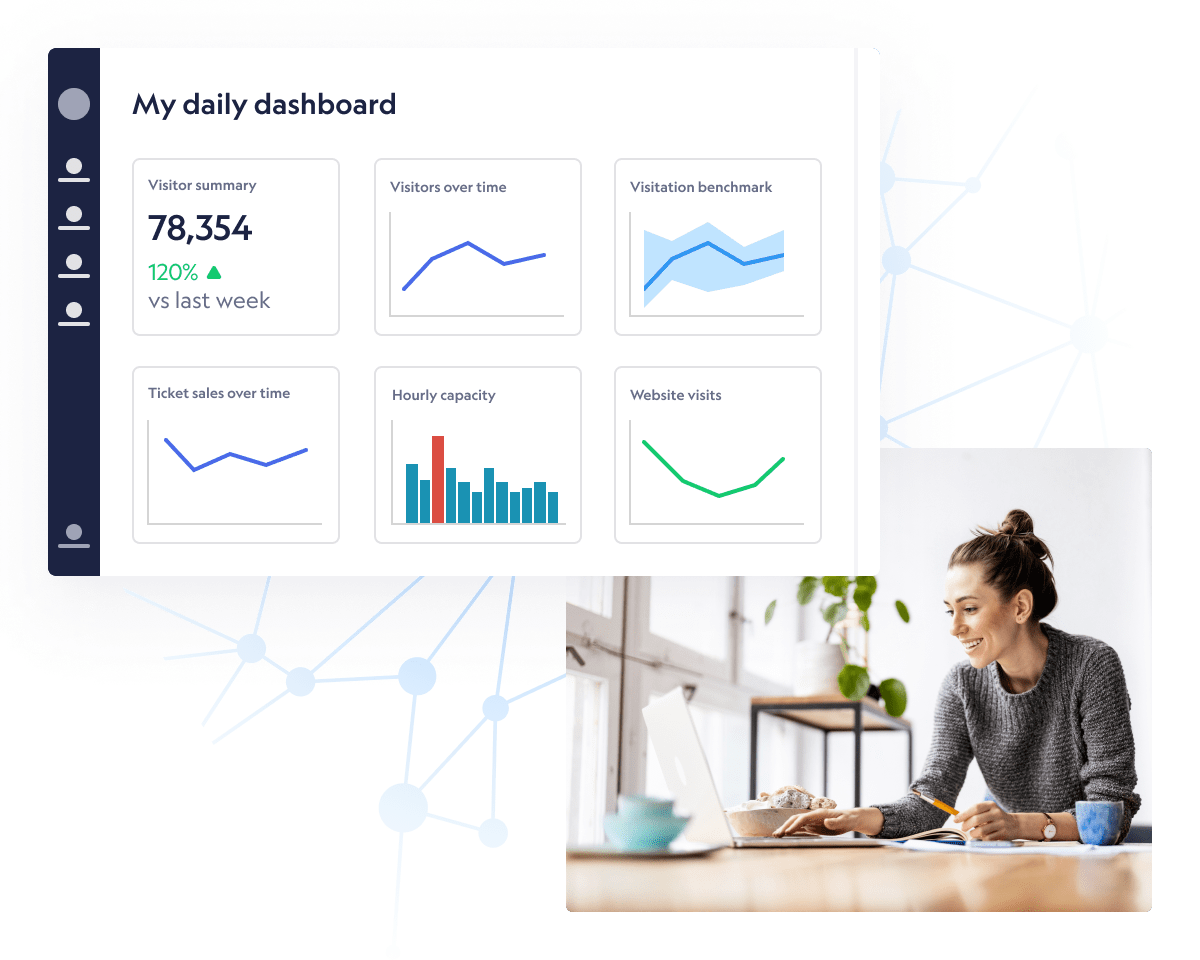
Create and share dashboards with ease with Dexibit’s industry specific visualization library and powerful studio – the data you need, the way you want it.
Send PDF reports via email with powerful relative dates and the ability to add your own narrative alongside visualizations and context.
From understanding the distance travelled by visitor origin to analyzing visitor pathways and dwell time onsite, access advanced analytics illustrated with creative and interactive visualizations
Predict visitation, revenue and more – down to the hour and up to a year ahead, with machine learning models specifically developed for visitor attractions and interactive simulations for scenario planning
Talk to one of our team to hear more on how to leverage your data landscape to drive growth.

As the global leader in big data analytics for visitor attractions, Dexibit takes privacy seriously. Read more about how we treat your privacy.

As the global leader in big data analytics for visitor attractions, Dexibit takes privacy seriously. Read more about how we treat your privacy.
Get actionable content sent directly to you. Use these insights to reach visitor management excellence at your attraction.
As the global leader in big data analytics for visitor attractions, Dexibit takes privacy seriously. Read more about how we treat your privacy.