DATA: East versus west – how does visitation recovery differ geographically?
- In Benchmarks
- Data bits
- 3 min read
Data from Dexibit’s global portfolio of visitor attractions.
Understanding how your venue’s visitation measures against a pre pandemic baseline helps add context for how the year is unfolding. It’s also useful if you’re thinking about your future goals and as a point of comparison with industry.
It is not uncommon for the various markets of the US to operate almost independently from one another, and this proved true once again during the pandemic. With state governments enacting widely varying policies on pandemic controls and society displaying very different attitudes towards COVID-19. As a result, visitor attractions have had a range of experiences in both the controls over opening they were subject to and the demand from visitors.
Overall since reopening, the US west coast has outperformed its eastern counterpart at 62% versus 43% recovery on pre pandemic visitation. Better still is the mid market at 68% overall, though it has been recently overtaken in this top spot. As at the end of the first half for the 2022 calendar year, the current rate of recovery in these markets has reached 81% on the west coast, 71% on the east coast and 75% across US elsewhere.
Using Dexibit?
All Dexibit plans, including our free visitation dashboard, benefit from access to industry benchmarks with our unique Recovery Index:
- All Dexibit plans, including our free visitation dashboard, benefit from access to industry benchmarks with our unique Recovery Index
- In Dashboards (search in your visualization library), look for benchmarks to access recovery over time, or recovery by days in and use the visualization drop down to select your local cohort of the 5 venues closest to you open on a given day
- Add your daily visitation stats to plot your venue’s recovery against pre pandemic performance (we recommend adding data for 2017 – 2019 plus data since reopening)
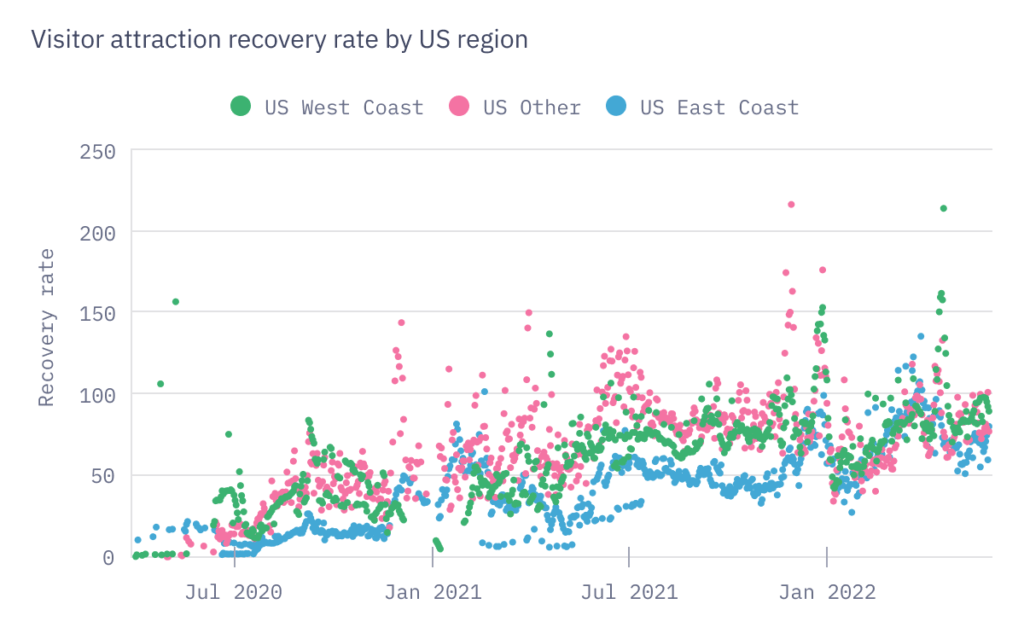
Average recovery rate over the course of the pandemic, US venues cohort attractions sector data by region
Dexibit’s Recovery Index for visitor attractions is calculated on a daily basis (where venues are open and data is available) from visitation compared to 2017 – 2019 when comparing similar days, as a rolling mean average.

Pooja Padhi
Data Engineer
Working across both data engineering and data science at Dexibit, Pooja is a data enthusiast with tremendous experience in data modelling, mining, analytics and visualisation, with a keen interest in forecasting and machine learning.


Want to learn more about Dexibit?
Talk to one of our expert team about your vision to discover your data and AI strategy and see Dexibit in action.

