How to visualize and analyze weather for dashboards, reports and insights.
Continue readingWebinar: Transparency and control with the Data Explorer
For system administrators and data owners, we dive deep into the behind the scenes world of data to achieve transparency and control across your data landscape.
Continue readingWebinar: Emotions in the voice of the visitor
We dig into tone, emotion, topic, theme, actionability and more using AI across freeform visitor feeedback
Continue readingWebinar: Powering insights with derived metrics
Curious about generative AI and its role in data analytics? We’ve just launched AI Query Assist. At the click of a magic wand, turn your words into DxQL for insight to answer any question.
Continue readingWebinar: From question to query with AI Query Assist
Curious about generative AI and its role in data analytics? We’ve just launched AI Query Assist. At the click of a magic wand, turn your words into DxQL for insight to answer any question.
Continue readingAI at the leadership table in visitor attractions
What the age of generative AI means for leadership teams in visitor attractions, cultural and commercial.
Continue readingBehind the scenes: how we shipped AI Query Assist
Ravi Chandra, Chief Product & Technology Officer at Dexibit reflects on the team’s experience discovering, designing and going to market with generative AI.
Continue readingWebinar: Almanac tips and tricks
The almanac is a calendar of what’s on in and around your location, used for context, machine learning and insight. Learn how to get the most from yours.
Continue readingWebinar: Planning with AI
Tune in to hear from Victoria Alogna, Lead Data Scientist at Dexibit to hear about the latest in machine learning developments in Dexibit, and how to use AI in forecasting and planning.
Continue readingThe pocket guide to ticketing analytics in visitor attractions
Here, we dissect the top Key Performance Indicators (KPIs) for retail analytics in visitor attractions, metrics to manage in reporting and insights to explore to increase visitor upsells.
Continue readingWebinar: Ticketing analytics in Dexibit
What does best in class ticketing analytics look like for visitor attractions? Learn key metrics and novel insights.
Continue readingWebinar: Retail analytics in Dexibit
Managing retail stores, food and beverage or other auxillary revenue in a visitor attraction, including with third parties? Tune in with Veronika Skyrpal for the latest in retail analytics with Dexibit.
Continue readingThe pocket guide to retail analytics in visitor attractions
Here, we dissect the top Key Performance Indicators (KPIs) for retail analytics in visitor attractions, metrics to manage in reporting and insights to explore to increase visitor upsells.
Continue readingWebinar: Writing queries in Dexibit
At Dexibit, we’ve begun to introduce a new query language called DxQL to our visualisations to help you discover new insights.
Continue readingWebinar: Forecasting with AI
In this webinar, we’ll take you through how to forecast with machine learning – how it works, how to inspect accuracy and how to use forecasts in your operation.
Continue readingDATA: How are visitor attractions growing?
With visitor attractions having returned to normal visitation compared to pre pandemic, the question for 2023 is – are they now growing?
Continue readingSketching data storyboards
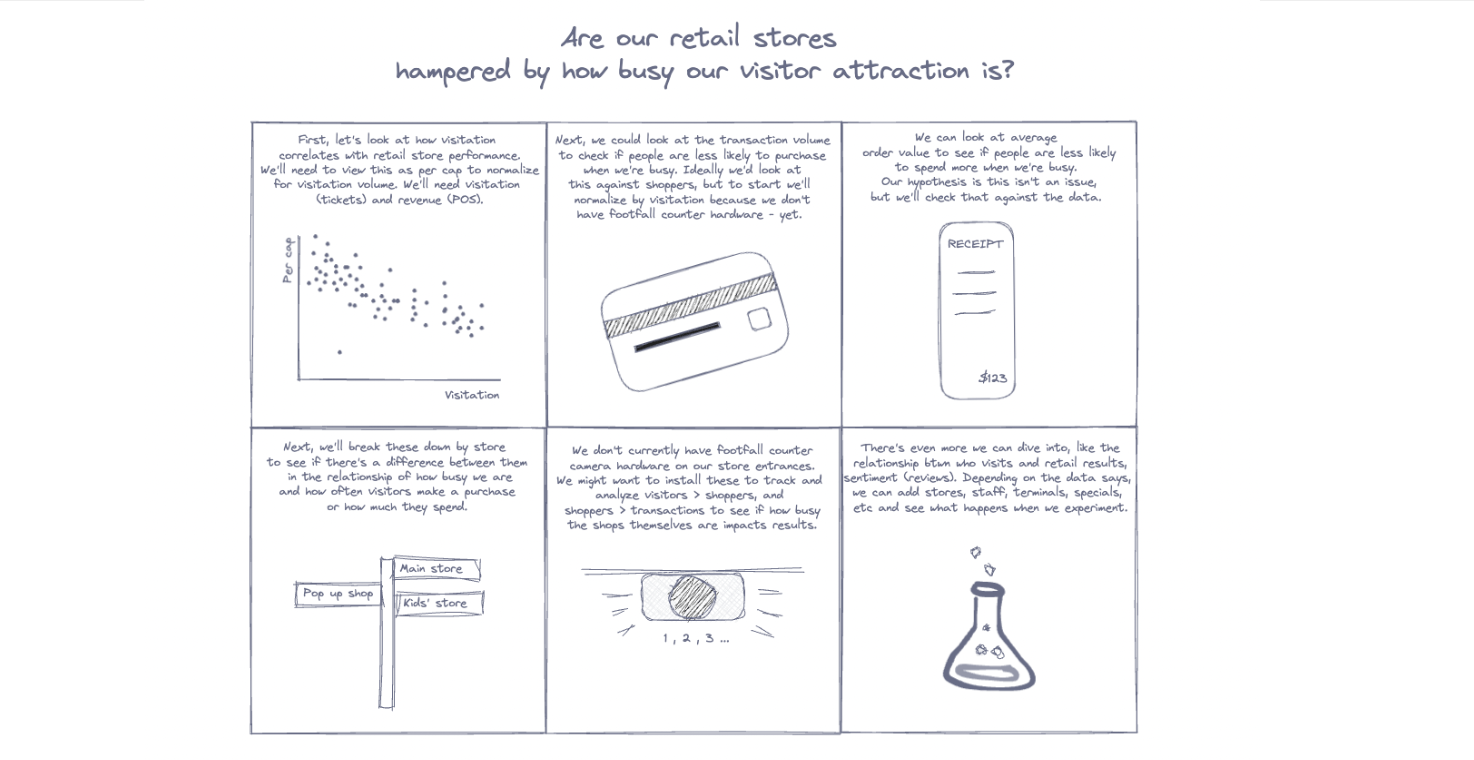
How to sketch out a data storyboard to shape a problem or challenge with data.
Continue readingWebinar: Designing data stories
In this webinar, we’ll take you through the journey of data story design and share our top tips and tricks for packaging and presenting data stories to share with your team and leadership.
Continue readingHow to measure dwell time in visitor attractions
We’re often asked about different options for measuring visitor dwell times… one of those elusive yet insightful metrics on visitor experience and behavior.
Continue readingLeading data at scale
Leading data programs across distributed teams presents many opportunities and challenges over and above those of individual venues.
Continue readingRevenue assurance: preventing revenue leaks
Revenue assurance involves monitoring and plugging revenue leaks in visitor attractions, ensuring that revenue is accurately recorded and collected. Some common areas to check for leaks include ticket scanning, legacy discounts, staff discounts, and members lending their passes to others.
Continue readingComparable metrics across multiple locations
Measuring the performance of visitor attractions with multiple locations can be a challenge given each can be different on the ground. We look at KPIs that stand up to comparability.
Continue readingBeyond per caps: commercial metrics for visitor attractions
When it comes to analyzing visitor attraction data, per caps only tell part of the story. By diving deeper into metrics like commercial conversion rates and average order value, leaders can uncover valuable insights to improve their commercial operations.
Continue readingDATA: What are typically popular times?
Insights from popular days and times, across Dexibit’s portfolio of visitor attractions.
Continue readingDear Dexibit: How do you spread demand outside popular times?
Is your visitation attraction pumping at midday on a Saturday, then dead during the week? It’s possible to fill traditionally quiet times and grow demand while spreading capacity.
Continue readingDATA: What impact is the recession having on memberships?
Insights from memberships and season passes showing the comparative impact of the recession and pandemic, across Dexibit’s portfolio of visitor attractions.
Continue readingNew year, new… UI
The new year has brought some exciting new changes to Dexibit’s app. Here’s a look at some of the user interface changes we’ve made with Dexibit’s Design Director, Daniel Jordan.
Continue readingDATA: Does Black Friday matter for visitor attractions?
Insights from Black Friday and Cyber Monday revenue data across Dexibit’s portfolio of visitor attractions.
Continue readingDATA: How does per cap revenue differ over time?
Insights from per cap revenue data across Dexibit’s portfolio of visitor attractions.
Continue readingDATA: Was 2022 a normal year for revenue in attractions?
Insights from revenue recovery data across Dexibit’s portfolio of visitor attractions.
Continue readingDATA: What do visitors complain about?
Insights from negative remarks gathered from online reviews across Dexibit’s portfolio of visitor attractions.
Continue readingDATA: What do happy visitors say?
Data and examples from positive remarks gathered from online reviews across Dexibit’s portfolio of visitor attractions.
Continue readingDATA: How happy are visitors?
Visitor happiness data gathered from online reviews across Dexibit’s portfolio of visitor attractions.
Continue readingDATA: East versus west – how does visitation recovery differ geographically?
It is not uncommon for the various markets of the US to operate almost independently from one another, and this proved true once again during the pandemic.
Continue readingDATA: How are visitor attractions recovering post pandemic?
Understanding how your venue’s visitation measures against a pre pandemic baseline helps add context for how the year is unfolding. It’s also useful if you’re thinking about your future goals and as a point of comparison with industry.
Continue readingDATA: Cultural versus commercial – which attractions segment is recovering faster?
Between visitor attractions globally, cultural institutions and commercial venues have experienced very different recovery rates, likely driven by a combination of risk profiles from management operating decisions around opening restrictions and by visitor behaviors in their likelihood to visit.
Continue readingBehind the scenes in product delivery at Dexibit
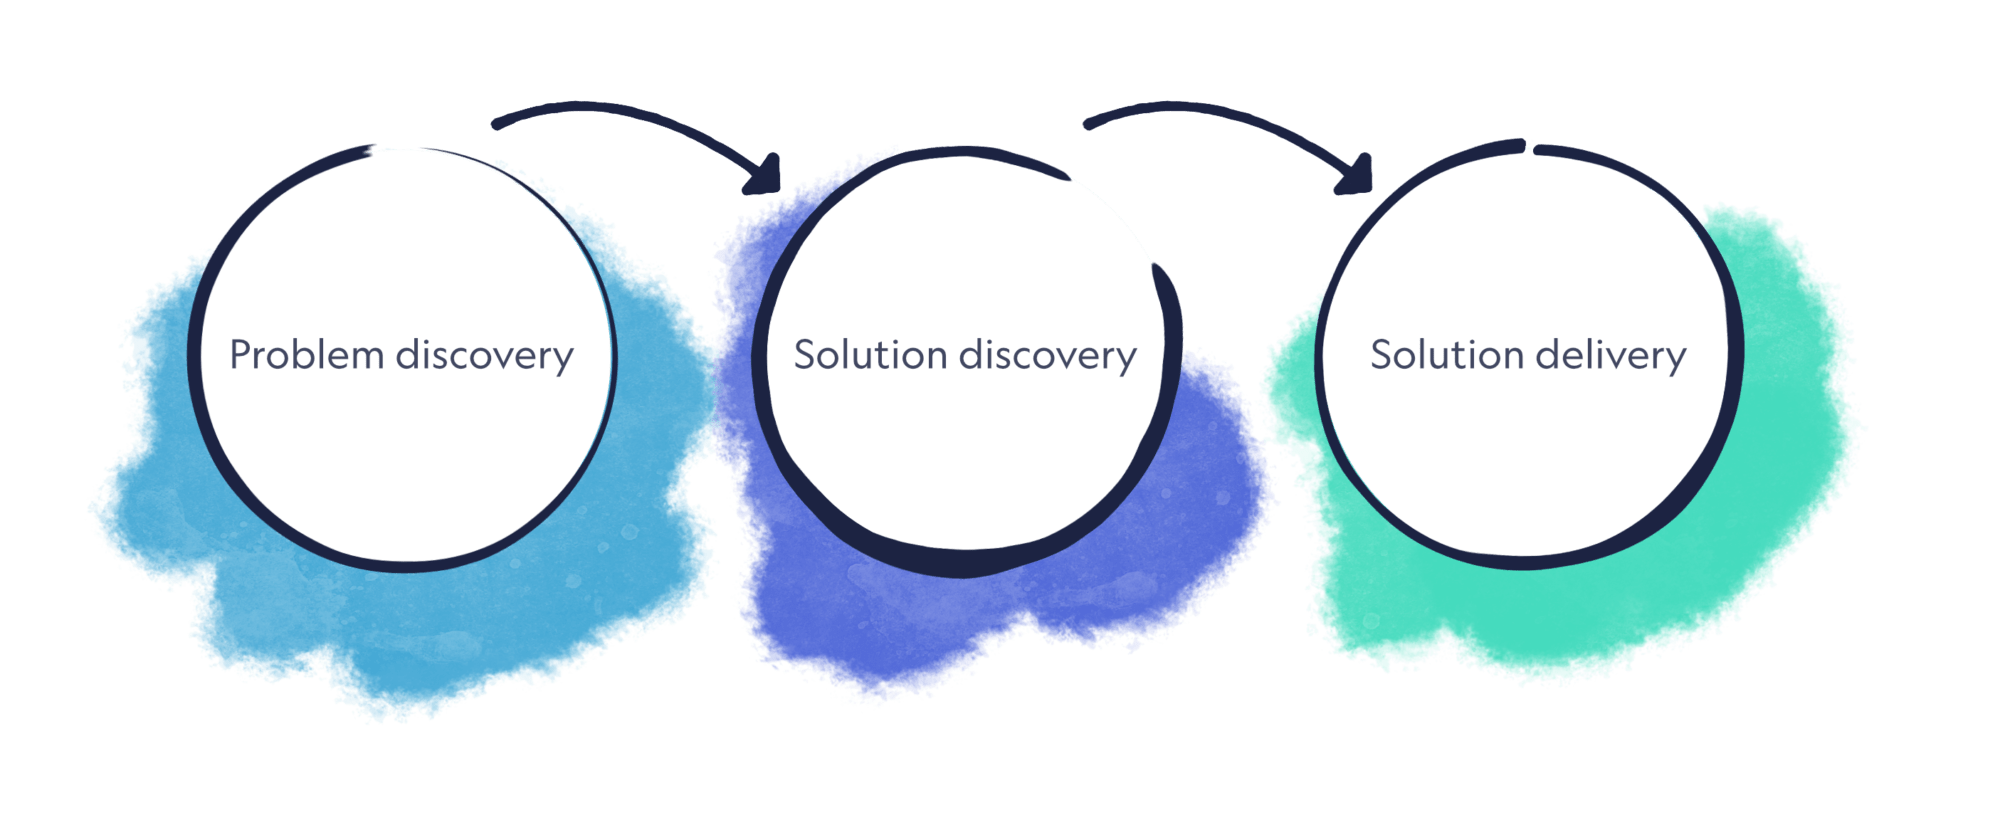
Curious about how we manage our product at Dexibit? Here’s a look from behind the scenes at our contemporary product best practices with Dexibit’s Product Director, Veronika Gower.
Continue readingDATA: How does visitor behavior for school breaks change through the year?
In the highly seasonal business of visitor attractions, not all school holidays were created equal. It’s important to understand the nuances of how various school holidays perform when comparing visitation results.
Continue readingDATA: How important are school breaks for visitor attractions?
Understanding how the impact at your venue compares with the attractions sector globally provides useful context for identifying growth opportunities and setting goals.
Continue readingDexibit achieves SOC 2 Type 1 for enterprise security
Dexibit, global provider of big data analytics for visitor attractions, achieves SOC 2 Type 1 for enterprise security.
Continue readingEasy phrases to encourage a data culture
Many attractions are putting data at the top of the investment agenda. Hardly surprising, given good growth needs insight and investments over the past few years have shown promising returns.
Continue reading7 Potential Data Roles for your Visitor Attraction
Many attractions are putting data at the top of the investment agenda. Hardly surprising, given good growth needs insight and investments over the past few years have shown promising returns.
Continue readingAvoid these 5 mistakes when hiring a data team
Hiring data teams at your attraction can be confusing. Chances are this is a new function for your team. Actionable tips to set you up for
Continue reading10 measures of success in exhibitions
When it comes to exhibitions, ‘performance’ is a debatable term – it’s not just about topline performance. Analyze simulations and plans.
Continue readingDemystifying Life Time Value (LTV) for visitor attractions
In recurring revenue model, member or fan Life Time Value (LTV) is an essential metric to track to understand true, sustainable growth.
Continue reading7 levers to tailor your loyalty for a powerful visitor experience
Shifting consumer behavior, changing buyer expectations and rising digital adoption are prompting attractions to rethink membership and loyalty in a fresh light.
Continue readingConfiguring your ticketing systems for visitor insights
Ticketing systems have been a savior for many visitor attractions managing new or tighter capacity constraints in the age of..
Continue readingPromote or Punish? When visitor attractions restrict the unvaccinated
It’s happened already in Israel, China, France, Italy and now hitting New York with the United Kingdom soon to follow suit: “restrict the..
Continue readingDiscover the three types of museum evaluation
The field of evaluation tends to get a bad rap. Like the words “engagement” or even “analytics” it can be difficult to know exact..
Continue readingHow to count visitors at your attraction through footfall
Alongside ticketing and membership, footfall – the metric of measuring people who pass into a space..
Continue readingHow to choose the right chart to visualize your data
Working out when to use what type of graph can be a challenge. A lot depends on what insight you’re looking for, as different graphs..
Continue reading5 ways attractions are using marketing to generate demand
Generating and capturing demand is a key component to recovery to hold audiences and regain visitation, in the wake of COVID-19.
Continue readingBreaking down the numbers per visit
What’s the net value of each visit at your venue? Is gross margin increasing or decreasing?
Continue readingFive seeds for artificial intelligence in museums
Satya Nadella, CEO of Microsoft, refers to the challenge as his mission to ‘democratize’ artificial intelligence by putting advanced..
Continue reading3 ways retail can create a superior visitor experience
An exit through the gift shop could easily be an afterthought of a few souvenirs in a visitor attraction. Yet it is such an important booken..
Continue reading20 questions to ask of your attraction’s visitation
These questions provide a framework for a full impact assessment report of COVID-19, when comparing before and after shutdown.
Continue readingEmpower, inspire, motivate: The data story of recovery
Nothing cuts quite like having to sit in front of the board, funders or even the team to explain that visitation is only a fraction of what..
Continue readingBuild vs buy: Calculating the total cost of ownership for big data analytics
What is the total cost of ownership? Within technology sectors, 85% of big data analytics projects in corporations fail.
Continue readingDexibit appoints Rick Ellis to Board
Dexibit welcomes former Te Papa Chief Executive Rick Ellis to its Board of Directors for the Dexibit Group, bringing more than 30 years of leadership.
Continue readingTypes of data to collect at your visitor attraction
A visitor’s journey can be segmented into three different stages: discovery (when visitors are researching options and ‘before you visit’..
Continue readingReflections on reopening and visiting attractions
Going into lockdown happened so fast it left me feeling like my head was spinning – but in contrast, reopening is a slow process. Which is just as well, because after..
Continue readingAdvice from senior leaders of reopened visitor attractions
During our #ReopenRun video series, we visited attractions operating post lockdown and interviewed 10 senior leaders..
Continue readingMaking the most of location analytics at your attraction
What do your visitors get up to once they step foot through your doors? Knowing where visitors go, what they do, what routes..
Continue readingTop 3 priorities for visitor attractions navigating reopening and recovery
The hardest part of leading through the crisis is still ahead of us: navigating the reopening and recovery.
Continue reading10 data tricks for marketing leaders in visitor attractions
Visitor attraction venues first need to be able to articulate Visitor Acquisition Cost (VAC), to identify the conversion rates in the buying..
Continue readingCOVID-19: Top 7 tech trends in the wake of the pandemic
Even the darkest clouds have silver linings. In many walks of life, COVID-19 fast tracked years of digital transformation in a few days..
Continue readingBuilding a robust museum evaluation
Shifting consumer behavior, changing buyer expectations and rising digital adoption are prompting attractions to rethink membership and loyalty in a fresh light.
Continue readingReopening looks like… Reopen Run
Dexibit launches unique Reopen Run video series showing the first visitor attractions in the world to reopen post pandemic with the visitor point of view and behind the scenes interviews.
Continue readingVisitor attractions band together
Dexibit hosts crisis talks for the visitor attractions sector as the COVID-19 pandemic begins, together with global industry associations and publications IAAPA, AAM and Blooloop.
Continue readingDexibit launches revenue forecasting
Dexibit announces predictions for visitor attraction revenue by line of business – down to the day and up to a year ahead, using its proprietary machine learning models.
Continue readingThe ammunition for blockbuster exhibitions
The argument against special exhibitions draws upon figures from limited studies taken out of context, trying to prove that success…
Continue readingComparing apples with exhibitions
Foundation financials – Total admissions, revenue and return on investment provide a simple financial perspective. Beware if..
Continue readingCrossing the exhibition chasm
Just as in Moore’s perspective, exhibition adoption curves can be segmented into: Innovators – those that like to be the first to..
Continue readingPredicting the future with Te Papa Tongarewa
Dexibit announces big data analytics partnership with Te Papa Tongarewa the national museum of New Zealand, including forecasting the museum’s visitation.
Continue readingThe National Gallery predicts the future with artificial intelligence
Dexibit announces big data analytics partnership with The National Gallery of London, including forecasting the museum’s performance in special exhibitions beginning with blockbuster Monet.
Continue reading
